Estimating pedestrian activity
How busy will the streets around a site be? A pipeline that answers it from census data, as a “buzz metric” generative design tools can use.
01Context
Generative design tools score design options against objectives. One question matters for almost any site: how busy will the streets around it be? Answering it needs data about who actually lives and works there.
That data was the bottleneck. Each geospatial dataset had to be found, cleaned and reshaped by hand before it could feed an objective function, which kept the tools stuck on narrow test cases. The first step was research into which use cases mattered most, and which standard datasets, like pedestrian activity and transit access, the tools needed to make their analyses more accurate.
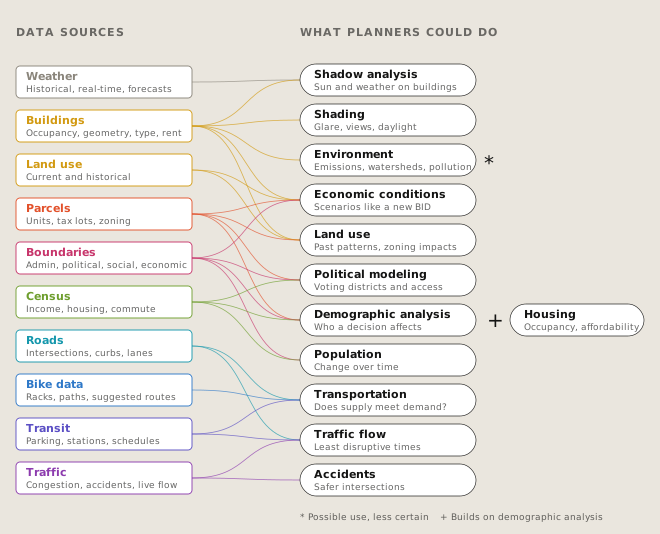
The research traced each kind of urban data, from weather to traffic, to the planning questions it could help answer. Building, parcel, boundary and census data fed the most questions, and all four describe who lives and works where. That pointed to the dataset built next: an estimate of the people around a site, and the activity they bring to its streets.
02Approach
A replicable, automated pipeline took the data from raw sources to street-level estimates in four steps:
- Ingestion. A series of automated processes pulled in census, parcel and building data and transformed it into a form the generative design tools could use.
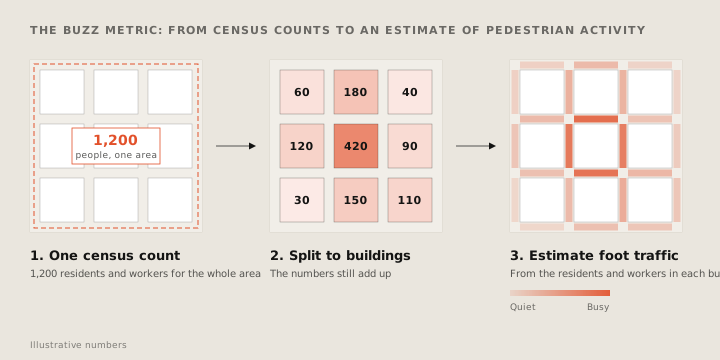
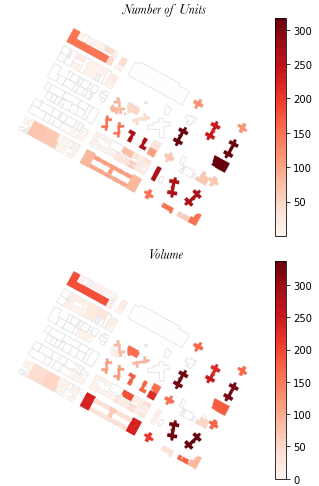
- Disaggregation. Census counts of residents and workers only come for large areas called block groups. The pipeline split those counts down to individual buildings, using building data such as unit counts and building type.
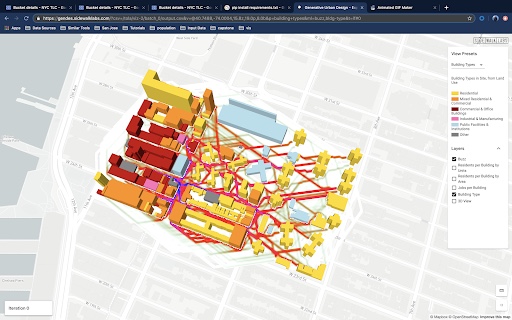
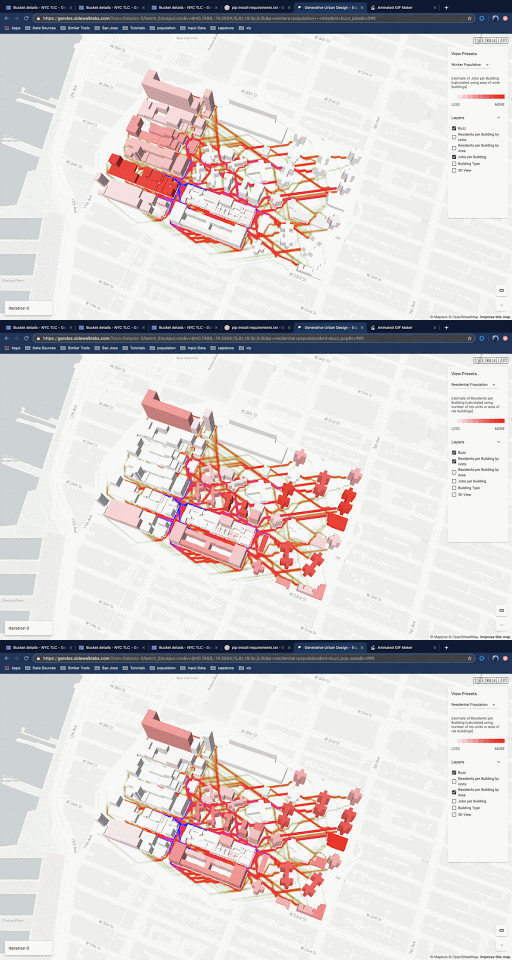
- Street-level activity. The people in each building, residents and workers, were turned into an estimate of pedestrian activity on the streets around it.
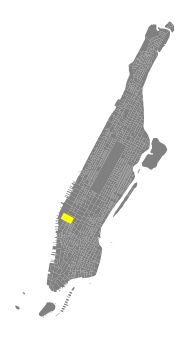
- Validation. The process was developed on a test site in Manhattan, then validated by replicating it in other cities and over a larger area.
03Outcome
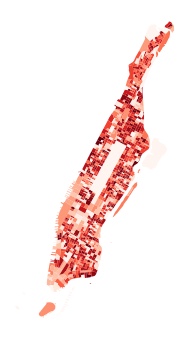
The result was a replicable, automated pipeline for bringing urban spatial data into generative design, validated beyond its test site. It produces building-level population, workforce and land use, plus a “buzz metric” that shows pedestrian activity from residents and workers.
Built to plug into the existing generative design workflow, it removed the manual data step that had kept the tool on narrow test cases. That opened the way to more varied, data-rich simulations to inform the optimization of city-scale prototypes.
Beyond the Blue Dot
Say hello.
Working on something for the built environment? I’d love to hear about it.